

The Carbon Cycle Explained: Reservoirs, Emissions and Disruption
The carbon cycle is the natural mechanism that moves carbon between the atmosphere, the oceans, soils and rocks. In 2019, human CO₂ emissions were projected to reach 43.1 billion tonnes [5], deepening an imbalance in a cycle that, before industrialization, had been relatively close to equilibrium.
Since the industrial era, this disturbance has been reshaping how carbon is distributed, driving in particular its buildup in the atmosphere and the acidification of the oceans. Looking at how the carbon cycle naturally works, what its main reservoirs are and how anthropogenic emissions affect it also helps clarify the role of solutions like CCUS, which are now being studied as part of the energy transition.
The Main Reservoirs of the Natural Carbon Cycle
The carbon cycle relies on continuous exchanges between several large reservoirs, including the atmosphere, the oceans, the terrestrial biosphere, soils and rocks. How big these pools are, and how quickly carbon moves between them, goes a long way toward explaining why some disturbances can have lasting effects.
Definition and General Structure
The carbon cycle refers to the movement of carbon, in various forms, through the atmosphere, the hydrosphere, the terrestrial and marine biospheres and the lithosphere. As it travels, carbon changes both its chemical form and its environment.
It can exist as CO₂ in the atmosphere, as organic carbon in biomass, as dissolved carbon in the oceans, or as carbon held in soils, sediments and rocks. To quantify these stocks, scientists often use the PgC, or petagram of carbon. One PgC equals 10¹⁵ grams, which is one billion metric tonnes of carbon.
Taken together, these components form a network of carbon reservoirs connected by a variety of exchange flows. [2]
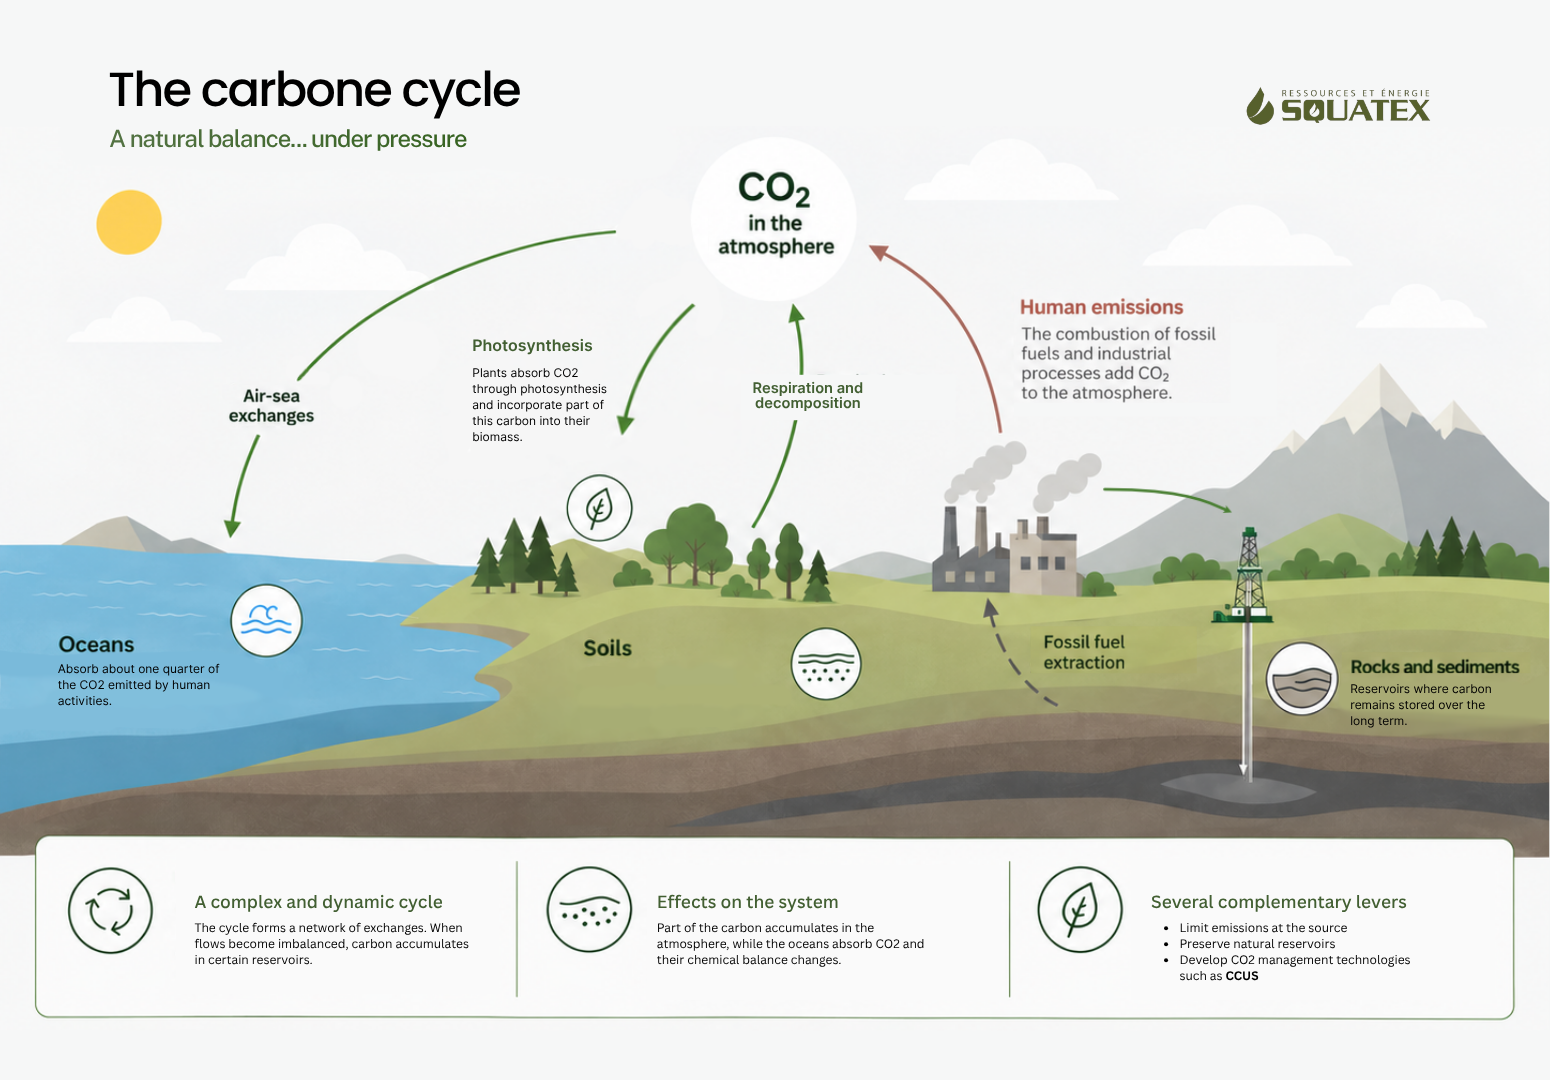
Figure 1: The Carbon Cycle
The Fast Cycle and the Slow Cycle
The IPCC divides the cycle into two broad domains. The fast domain covers exchanges between the atmosphere, the oceans, vegetation and soils. Depending on the reservoir, turnover times can range from a few years to several millennia. [2]
The slow domain, for its part, encompasses the vast carbon stocks found in rocks and sediments. It interacts with the fast domain mainly through volcanic activity, chemical weathering of rocks, erosion and the formation of sediments on the seafloor. [2]
This distinction helps place the impact of fossil fuels within the cycle. Their carbon belongs to the slow domain and accumulated over geological timescales. Burning them rapidly shifts part of that carbon into the atmosphere and, more broadly, into the fast domain of the cycle.
Reservoir Sizes in Numbers
Table I: Estimated size of the main carbon reservoirs
| Reservoir | Estimated size |
|---|---|
| Oceans (dissolved inorganic carbon) | ~38,000 PgC |
| Mineral-associated organic carbon (MOC), non-permafrost mineral soils (0–1 m) | ~899 PgC, or about 69% of total organic carbon |
| Northern peatlands | 415 ± 150 PgC |
| Boreal forests | ~272 ± 23 PgC |
Northern peatlands are a particularly striking example of how concentrated carbon can be in certain ecosystems. They cover roughly 2% of the Earth's land surface and hold an estimated 415 ± 150 billion tonnes of carbon, whereas boreal forests, which occupy nearly 8% of the land, store about 272 ± 23 billion tonnes. [4] Despite the uncertainty surrounding these figures, the comparison highlights the major role peatlands play in terrestrial carbon storage.
How Carbon Moves: The Main Natural Mechanisms
The reservoirs of the carbon cycle are linked by ongoing exchanges. In the oceans as on land, a range of processes governs how carbon is absorbed, transformed, transported and retained over time.
Physico-Chemical Ocean Uptake
The oceans naturally trade CO₂ with the atmosphere. When it dissolves in seawater, some of the CO₂ forms carbonic acid, which then converts into other chemical species. This process leads in particular to:
an increase in bicarbonate ions (HCO₃⁻);
an increase in hydrogen ions (H⁺);
a decrease in carbonate ions (CO₃²⁻). [3]
This uptake feeds the ocean carbon sink, but it also alters seawater chemistry. The rise in hydrogen ions gradually lowers pH, which is the root of the ocean acidification discussed later in this article.
The Ocean's Biological Pump
The biological carbon pump is another key mechanism. It unfolds in several stages:
phytoplankton take up CO₂ during photosynthesis and incorporate it into organic matter;
some of this carbon then moves through the marine food web;
organisms, particles and biological debris gradually sink through the water column;
a fraction of the carbon reaches deep waters and, in some cases, marine sediments. [7]
Much of this material is recycled before it gets to great depths, yet on average about 2 to 3 billion tonnes of carbon per year reach the ocean floor. [7] The biological pump thus drives the vertical transport of carbon and shapes how dissolved inorganic carbon, nutrients and pH are distributed throughout the oceans.
Storage on Land: Soils and Peatlands
On the continents, soil carbon storage depends largely on the accumulation of organic matter and how it interacts with minerals. In the top metre of the non-permafrost mineral soils studied by Georgiou et al., mineral-associated organic carbon amounts to roughly 899 billion tonnes of carbon, close to 69% of the total organic carbon in those soils. [6] This bond with mineral particles can help preserve carbon over long periods.
Peatlands work differently. In their waterlogged soils, plant matter breaks down more slowly, which allows peat to build up gradually. In the ecosystems examined by Beaulne et al. [4]:
peat stores about 22.6 to 66.0 kg of carbon per square metre;
tree biomass holds about 2.8 to 5.7 kg per square metre.
Human Disruption of the Carbon Cycle: Emissions and Measurable Consequences
The carbon cycle has gone through many natural fluctuations over Earth's history. The current disturbance stands apart, however, because of the rapid addition of large quantities of carbon, mostly from fossil fuels and land-use change. The oceans and terrestrial ecosystems take up part of this carbon, while the remainder accumulates in the atmosphere.
The Scale of Anthropogenic Emissions
In 2019, the Global Carbon Project estimated that global human-caused CO₂ emissions would reach 43.1 billion tonnes, within an uncertainty range of 39.9 to 46.2 billion tonnes. Emissions from fossil fuels and industry alone were projected at nearly 37 billion tonnes of CO₂ for that same year. [5]
These anthropogenic emissions come on top of natural carbon flows that are far larger in volume. The difference lies in the fact that, in a relatively balanced cycle, natural exchanges between the atmosphere, the oceans and land ecosystems largely offset one another. Human activities add an extra flow that natural sinks cannot fully absorb. [2][9]
Why Natural Sinks Don't Fully Offset Emissions
The global carbon budget can be summed up as follows: emissions from fossil fuels and land-use change are partly offset by uptake from the oceans and terrestrial ecosystems. Whatever is left over adds to the carbon in the atmosphere. [9]
The oceans absorb roughly a quarter of anthropogenic CO₂ emissions. [3] Land and vegetation also capture a significant share, but these natural processes don't cancel out all emissions.
Protecting existing stocks is another major concern. Ecosystems hold at least 260 billion tonnes of carbon described as irrecoverable, particularly in peatlands, mangroves, old-growth forests and marshes. [10] If released, these stocks could not be naturally rebuilt within timeframes compatible with climate goals.
Ocean Acidification: A Measurable Indicator
Ocean acidification offers a direct illustration of what happens when the oceans absorb anthropogenic CO₂. According to the IPCC, the pH of open-ocean surface waters has been declining at a rate of 0.017 to 0.027 pH units per decade since the late 1980s. [3]
Because the pH scale is logarithmic, even a change that looks small reflects a significant shift in water chemistry.
This trend reduces the availability of the carbonate ions that many marine organisms rely on to build their calcareous structures, including corals, molluscs and certain planktonic species. [3]
Thus, restoring balance to the carbon cycle depends on several complementary levers: cutting emissions at the source, preserving natural sinks and limiting the loss of existing stocks. In sectors where some emissions remain hard to avoid, carbon capture, utilization and storage (CCUS) technologies are also being explored to reduce CO₂ releases and, in certain configurations, help remove it permanently from the atmosphere.
CCUS: A Complementary Lever for Carbon Management
When emission cuts and natural sinks fall short of offsetting CO₂ releases, carbon capture, utilization and storage (CCUS) can serve as an additional lever. These technologies primarily aim to capture CO₂ before it enters the atmosphere and, depending on the setup, either put it to use or store it durably.
A Set of Complementary Technologies
CCUS involves several distinct stages: capture, transport, utilization and storage of CO₂. Carbon can be captured from industrial processes or energy facilities. Some technologies can also pull CO₂ directly out of the atmosphere.
The IEA points out that CCUS is among the technologies capable of serving two complementary goals: reducing emissions in certain hard-to-decarbonize sectors and, in some configurations, permanently removing CO₂ from the atmosphere to offset residual emissions. [12]
CCUS is currently expanding worldwide and fits into a broader portfolio of carbon management solutions. Alongside emission reductions, energy efficiency and the preservation of natural sinks, it can help support the shift toward lower-carbon energy systems.
Conclusion: Complementary Solutions for Better Carbon Management
The carbon cycle rests on a dynamic balance between the atmosphere, the oceans, soils, the biosphere and rocks. Human activities have upset this balance by rapidly adding carbon to the system, while natural sinks absorb only part of it. The response therefore calls for several complementary levers, including cutting emissions, protecting natural reservoirs and developing technologies that can better manage CO₂ flows.
From this perspective, CCUS can help curb certain emissions and, depending on the configuration, store captured carbon over the long term. Another avenue is to use captured CO₂ as a resource, for example as a feedstock for certain fuels, materials or chemicals. This approach opens up new ways to integrate captured carbon into value chains rather than treating it solely as waste to be managed.
Key takeaways
The carbon cycle distributes carbon across several major reservoirs, including the atmosphere, the oceans, soils, the biosphere and rocks. The oceans alone hold about 38,000 billion tonnes of carbon. [2]
In 2019, global human-caused CO₂ emissions were projected at 43.1 billion tonnes, illustrating the scale of the carbon flow that human activities add every year. [5]
Ocean acidification has been advancing at a rate of 0.017 to 0.027 pH units per decade since the late 1980s. [3]
Northern peatlands cover roughly 2% of the Earth's land surface and store some 415 ± 150 billion tonnes of carbon, a central estimate higher than that of boreal forests. [4]
CCUS is the only group of technologies identified by the IEA as contributing both to directly cutting emissions in certain sectors and to removing CO₂ from the atmosphere to offset hard-to-avoid emissions. [12]
References
[2] Intergovernmental Panel on Climate Change. "Chapter 6: Carbon and Other Biogeochemical Cycles." Climate Change 2013: The Physical Science Basis, Cambridge University Press for the IPCC, 2013, https://www.ipcc.ch/site/assets/uploads/2018/02/WG1AR5_Chapter06_FINAL.pdf
[3] Intergovernmental Panel on Climate Change. "Chapter 5: Global Carbon and Other Biogeochemical Cycles and Feedbacks." Climate Change 2021: The Physical Science Basis, IPCC, 2021, https://www.ipcc.ch/report/ar6/wg1/chapter/chapter-5/.
[4] Beaulne, J., et al. "Peat deposits store more carbon than trees in forested peatlands of the boreal biome." Scientific Reports, vol. 11, article 2657, 2021., Nature, https://www.nature.com/articles/s41598-021-82004-x.
[5] Global Carbon Project. "Global Carbon Emissions Increase but Rate Has Slowed." Global Carbon Budget 2019, Global Carbon Project, 2019, https://www.globalcarbonproject.org/carbonbudget/archive/2019/UK_UEA_GCB2019.pdf.
[6] Georgiou, K., et al. "Global Stocks and Capacity of Mineral-Associated Soil Organic Carbon." Nature Communications, vol. 13, 2022, https://www.nature.com/articles/s41467-022-31540-9.
[7] Kelly, K. J., Larkin, A. A., Munro, D., et al. NOAA Oceanic and Atmospheric Research Ocean Carbon Observing Science Plan FY25 to FY35. NOAA, 2025., https://globalocean.noaa.gov/wp-content/uploads/2025/05/NOAA-OAR-Ocean-Carbon-Observing-Science-Plan-FY25-FY35_final.pdf.
[8] Environment and Climate Change Canada. "Greenhouse Gas Emissions." Canadian Environmental Sustainability Indicators, Government of Canada, 2026, https://www.canada.ca/en/environment-climate-change/services/environmental-indicators/greenhouse-gas-emissions.html.
[9] Intergovernmental Panel on Climate Change. "Chapter 5: Global Carbon and Other Biogeochemical Cycles and Feedbacks." Climate Change 2021: The Physical Science Basis, IPCC, 2021, https://www.ipcc.ch/report/ar6/wg1/downloads/report/IPCC_AR6_WGI_Chapter05.pdf.
[10] Goldstein, A., et al. "Protecting Irrecoverable Carbon in Earth's Ecosystems." Nature Climate Change, vol. 10, 2020, pp. 287–295, https://www.nature.com/articles/s41558-020-0738-8.
[12] International Energy Agency. CCUS in Clean Energy Transitions, IEA, 2020, https://www.iea.org/reports/ccus-in-clean-energy-transitions.
